Sensitivity
KATRIN is expected to achieve the following sensitivities for the mass of the electron neutrino:
Sensitivity:
(90% upper limit if neutrino mass is zero)
0.2 eV
with about equal contributions of statistical and systematical errors.
Discovery potential:
A neutrino mass of 0.35 eV would be discovered with 5 sigma significance.
A neutrino mass of 0.30 eV would be discovered with 3 sigma significance.
These values were accepted as realistic at the 4th collaboration meeting, June 2003, Rez/Prague.
Systematic uncertainties are expected to amount to an equal size as the statistical errors after a measuring time of 3 full years, using an analyzing interval of 30 eV below the endpoint. These are especially:
- Time variation of parameters of the Windowless Gaseous Tritium Source (WGTS),
- description of space charging within the WGTS,
- determination of scattering probabilities of β-electrons within the WGTS,
- description of the final state distribution of (3HeT)+ ions after tritium decay,
- variations of the retarding potential,
- and the limited uniformity of the magnetic and electrostatic fields in the spectrometer analyzing plane.
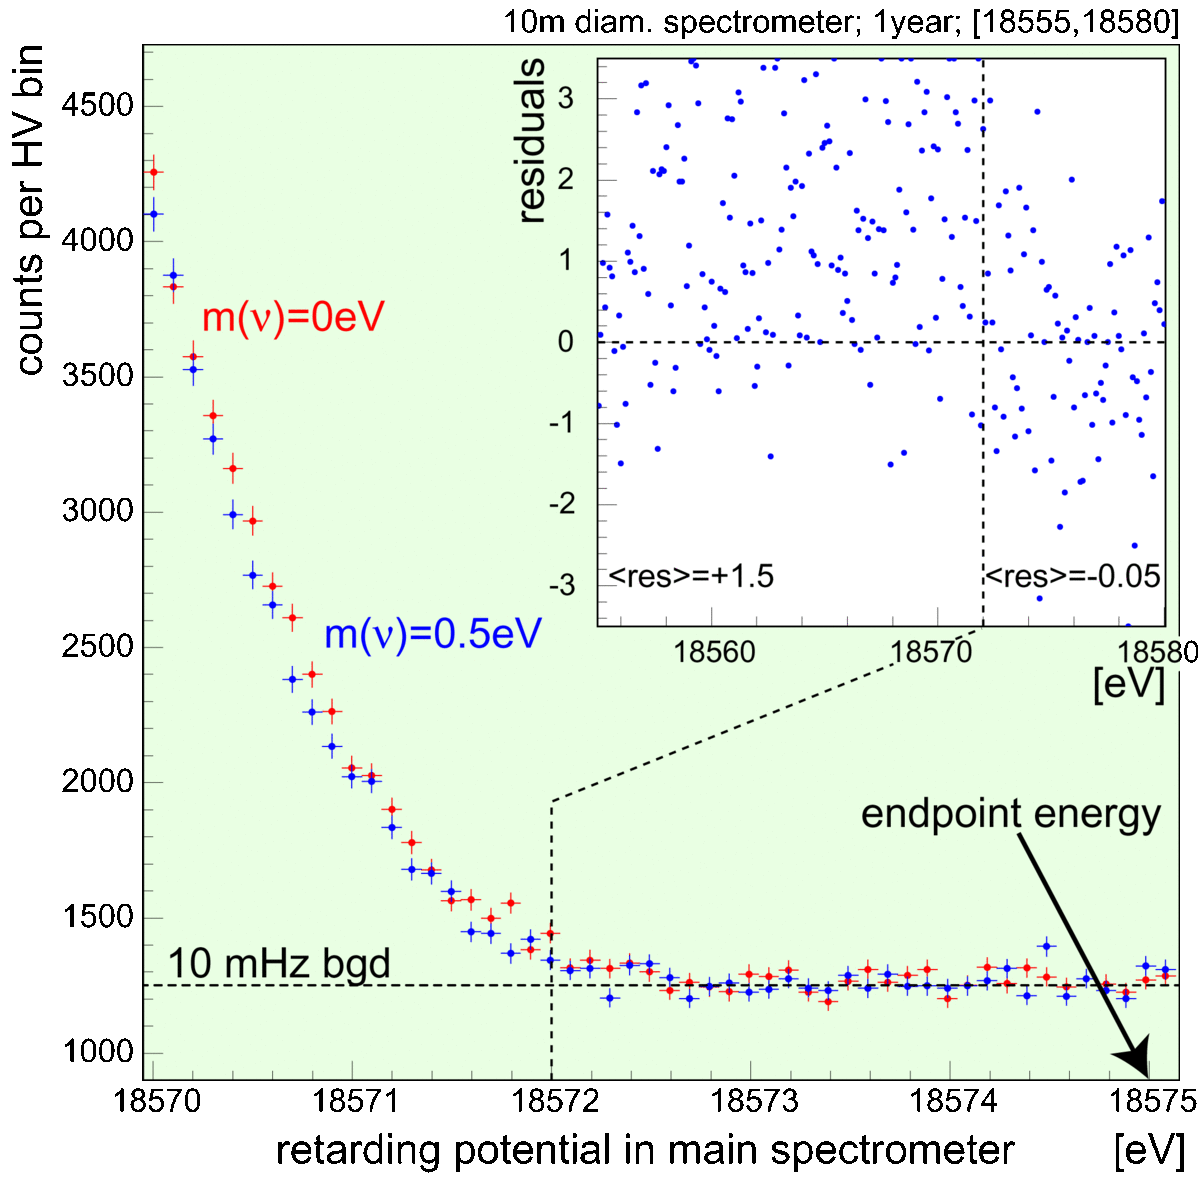
The inset shows, for a 5 times larger energy window, the difference of the two results, normalized to (i.e. divided by) the statistical error of the difference. Mean values of these residuals are given for the interval below 18572 eV, dominated by electrons from tritium β-decay, and above that energy, dominated by background.
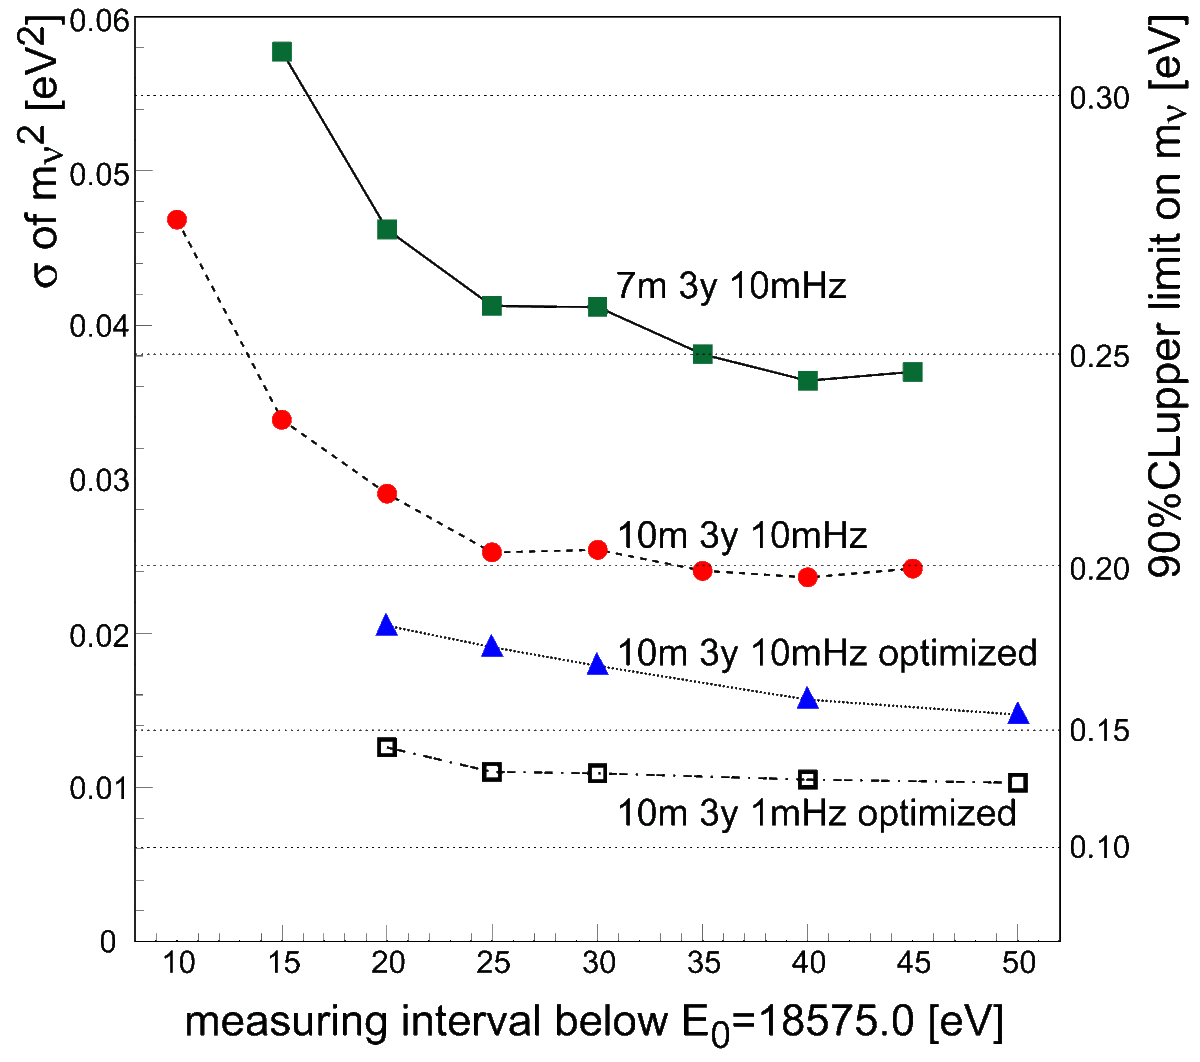
The figure demonstrates how sensitive the experimental setup has to be in order to differentiate neutrino masses even smaller than 0.5 eV from zero within the very small energy window below the endpoint energy! One clearly sees that a longer measuring time will help. Simulations have also shown (see second figure) that for a given total measuring time the sensitivity can be improved by allocating the time for each data point according to its weight for the analysis.
The second figure shows a calculation of the expected accuracy on mν2 for a data taking of three years. Only statistical uncertainties are shown as a function of the fit interval below the endpoint E0. The complete transmission and response function of the experimental setup is taken into account as well as the final state distribution of the (3HeT)+ ionized daughter molecules. Various steps of optimization of the KATRIN configuration as specified in [1] (green squares) can be seen:
1. Increase in diameter of the spectrometer vessel (7m → 10m) and of the tritium source (7cm → 9cm) as well as an improved tritium isotopic purity (70% → 95%) (red circles).
2. Optimized distribution of electron energy thresholds (retarding voltage!) used and time spent for each (blue triangles). This corresponds to the KATRIN reference setup[2].
3. Reduction of the expected overall background from 10 mHz to 1 mHz (black empty squares).
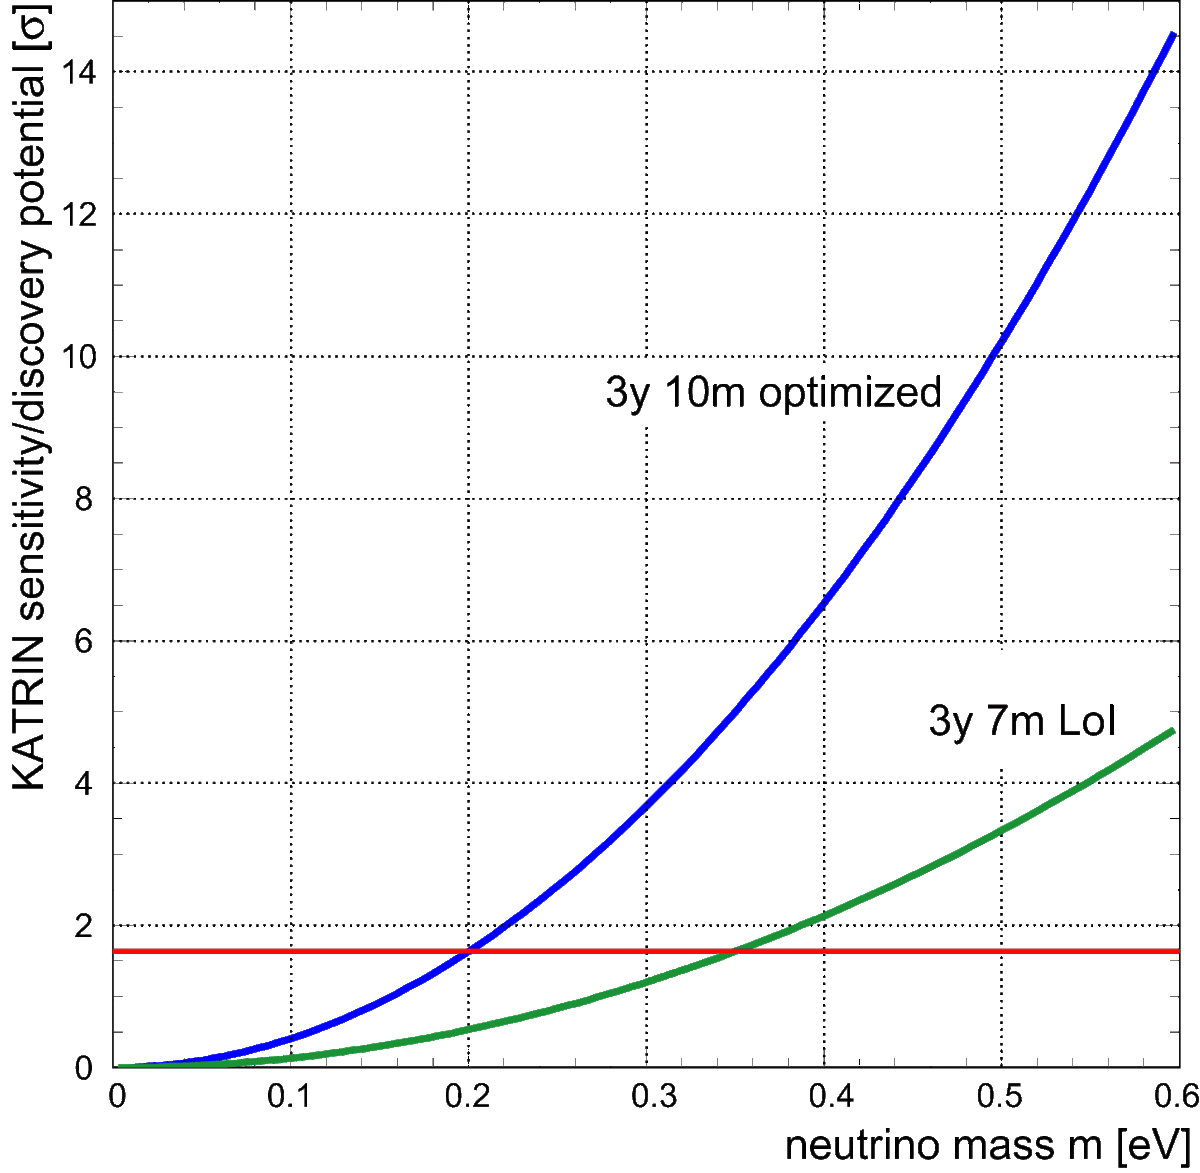
The third figure demonstrates the KATRIN discovery potential, in units of the Gaussian uncertainty σ, as a function of the potential neutrino mass for the older setup as outlined in [1] (3 years, 7m spectrometer) and of the current configuration (3 years, 10m, optimized). In both cases the expected overall background is 10mHz. Note the improvement, e.g. from 1.64σ to 5σ for an assumed mass of mν=0.35eV!
The constant line at 1.64σ indicates the expected upper limit on mν with 90% confidence in case of a zero-mass result.
References
[1] KATRIN Collab., Letter of Intent (2001)[2] G.Drexlin, Eur. Phys.J.C33, s01 (2004)